The lack of available homes to purchase has resulted in buyers competing against each other to buy despite low demand.
Low Supply and Multiple Bids
Market Times have dropped like a rock since the start of the year, squeezed by not enough sellers.
In-N-Out has arguably the best cheeseburger. What started in Los Angeles has spread to nearly 400 locations in five states. They are also known for their long drive-thru lines. To avoid the long wait, many hungry, wise hamburger connoisseurs head over at a more favorable time, like 3 p.m. Unfortunately, to their surprise, they are greeted by an unexpected mile-long line.
Many buyers have a similar experience as they dive into today’s housing market. After hearing about falling home prices due to sky-high mortgage rates, they expect housing to be slow so they can take their time and not compete in purchasing a home. Instead, they are experiencing long lines of buyers at open houses and multiple offers on homes priced right and in reasonably good condition. Home buyers are frustrated once again.
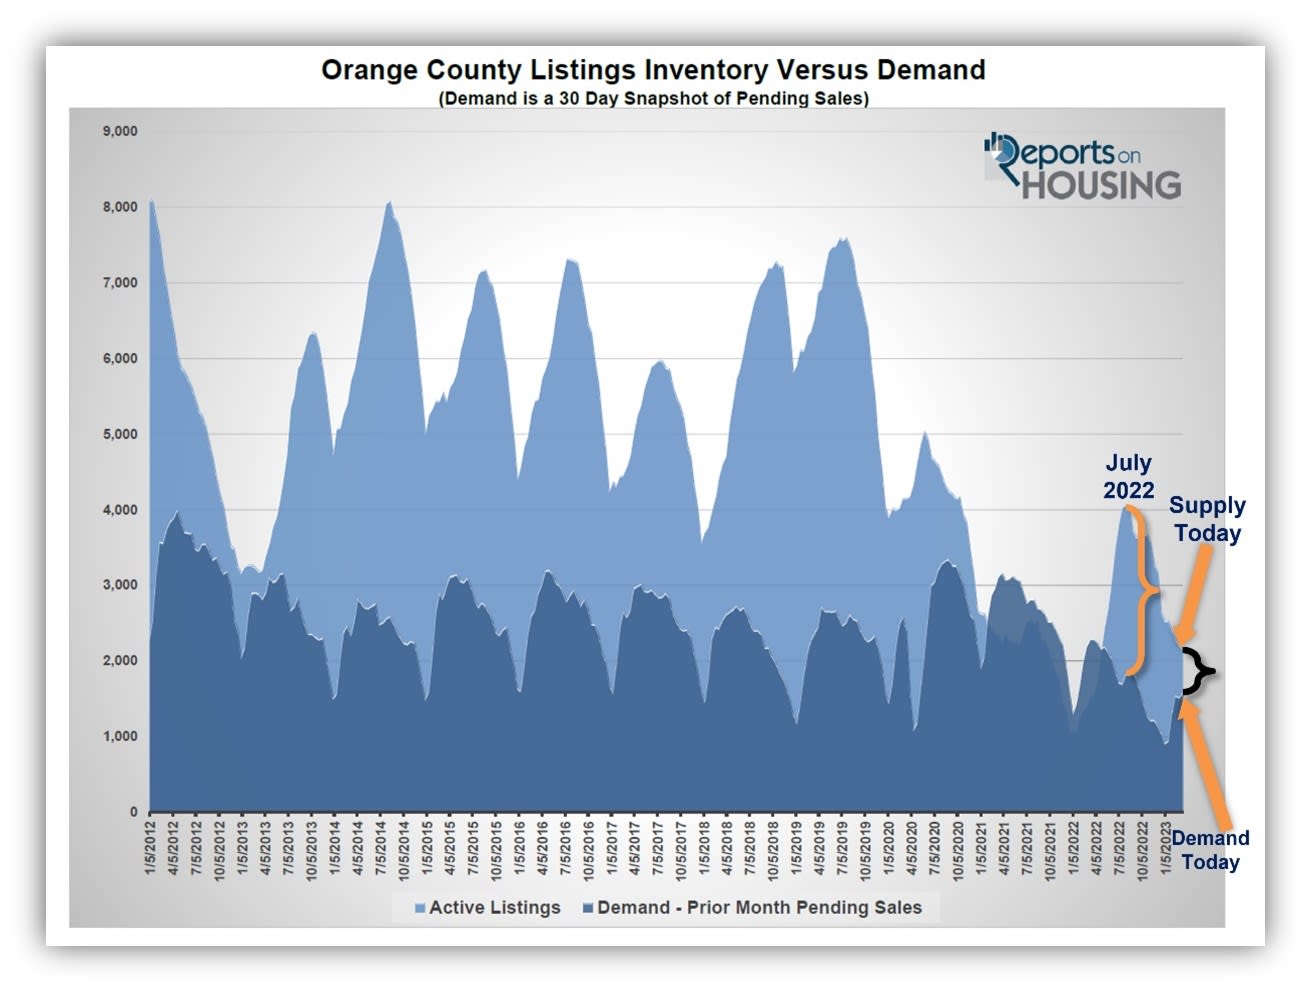
OC Housing Report Summary
- The active listing inventory in the past couple of weeks decreased by 50 homes, down 2%, and now sits at 2,168, the second-lowest March level since tracking began in 2004 behind last year. In February, 45% fewer homes came on the market compared to the 3-year average before COVID (2017 to 2019), 1,413 less. Last year, there were 1,556 homes on the market, 612 fewer homes, or 28% less. The 3-year average before COVID (2017 to 2019) was 5,286, or 144% more.
- Demand, the number of pending sales over the prior month, increased by 62 pending sales in the past two weeks, up 4%, and now totals 1,567, its highest level since September. Last year, there were 2,284 pending sales, 46% more than today. The 3-year average before COVID (2017 to 2019) was 2,514, or 61% more.
- With demand rising and supply falling, the Expected Market Time, the number of days to sell all Orange County listings at the current buying pace, decreased from 44 to 42 days in the past couple of weeks, its lowest level since May of last year. It was 20 days last year, much stronger than today.
- For homes priced below $750,000, the Expected Market Time decreased from 39 to 31 days. This range represents 22% of the active inventory and 30% of demand.
- For homes priced between $750,000 and $1 million, the Expected Market Time decreased from 29 to 28 days. This range represents 17% of the active inventory and 26% of demand.
- For homes priced between $1 million to $1.25 million, the Expected Market Time decreased from 36 to 33 days. This range represents 10% of the active inventory and 13% of demand.
- For homes priced between $1.25 million to $1.5 million, the Expected Market Time increased from 38 to 39 days. This range represents 10% of the active inventory and 10% of demand.
- For homes priced between $1.5 million to $2 million, the Expected Market Time increased from 48 to 51 days. This range represents 11% of the active inventory and 9% of demand.
- For homes priced between $2 million and $4 million, the Expected Market Time in the past two weeks decreased from 73 to 72 days. For homes priced between $4 million and $6 million, the Expected Market Time increased from 128 to 151 days. For homes priced above $6 million, the Expected Market Time decreased from 312 to 254 days.
- The luxury end, all homes above $2 million, account for 29% of the inventory and 11% of demand.
- Distressed homes, both short sales and foreclosures combined, comprised only 0.5% of all listings and 0.1% of demand. Only four foreclosures and six short sales are available today in all of Orange County, with ten total distressed homes on the active market, unchanged from two weeks ago. Last year there were three total distressed homes on the market, similar to today.
- There were 1,270 closed residential resales in February, 28% less than February 2022’s 1,774 closed sales. February marked a 12% increase compared to January 2023. The sales-to-list price ratio was 99.1% for all of Orange County. Foreclosures accounted for 0.1% of all closed sales, and there were no closed short sales. That means that 99.9% of all sales were good ol’ fashioned sellers with equity